1-year CD Rates vs. 5-year CD Rates – A Case Study
August 28th, 2012
Excample
One of our clients recently rolled over a CD that they have held at the same bank since Feb 2000. They have primarily rolled for a 1-year CD Term; except for the last few years where they have extended a little to boost their yield a bit. With real data in hand, we can present an interesting study on what the client would have earned if they had selected 5-year CDs vs. the 1-year.
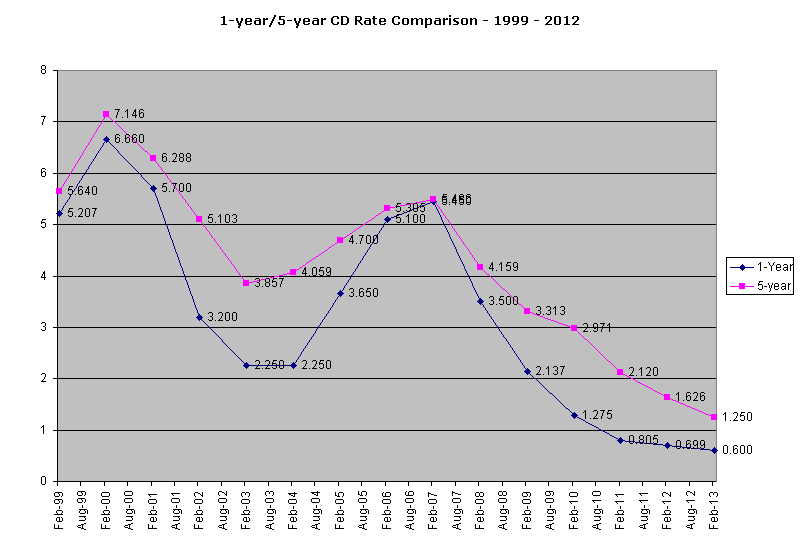
First, the below graph shows average 1-year and 5-year CD rates during February of each year since 1999. In most years, there is at least a 0.50% difference. Some years the difference was as high as 1.50% to 1.80%. A couple of years the difference was minimal, and although the graph doesn’t show it, we even had inverted yields a couple of times (i.e, the 1-year was higher than the 5-year). However, just comparing rates, we get an average difference of about 1.00% (4.412% vs 3.420%)

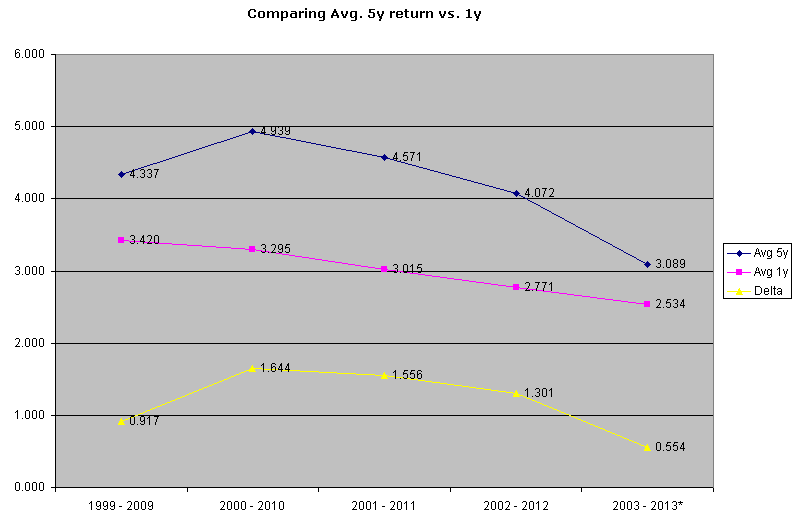
Second, the next graph shows what the return would have been if the client had abandoned 1-year CDs for 5-year certificates of deposit. I even went back a year to 1999. In February of 1999, the average 1-year CD rate was 5.207% and the average 5-year was 5.604% (one of those times, where there wasn’t much of an incentive to go long-term). 5-years later, in February of 2004 the average 5-year rate was 4.059%. Then in February of 2009 it was 3.313%. So the average return if they had done 5-year CDs was 4.337%. As stated above, the 1-year return was 3.420%. Looking at all of the opportunities to have switched, each 5-year series beats the corresponding 1-year rates. Note, I estimated a 5-year rate of 1.25% and a 1-year rate of 0.60% for February 2013 for the last series starting with 2003.

Some interesting observations
First, by extending their term a little the last few times the CD matured, the client boosted their average return to a 3.55%. Although that difference isn’t huge, it is a little bit. They opted for an 18-month roll in February of 2009, a 2-year in August of 2010, and just recently a 3-year.
There have only been three, five-year periods where rates increased (1993,1998 [not graphed]; 2002,2007 and 2003, 2008 [although rates were on a downward trend at this point]). In general, periods of rising rates don’t last longer than five years. So yes at some point, rates will rise (late 2014?), but more than likely, they will fall down again within five years (before 2019). Although there is a better than average chance that your 2017 5-year rates will be higher, that may not be true for 2018 and beyond.
Trying to time the market can be quite detrimental to your returns. When rates peaked in 2000 and 2007 many people shortened up their terms because they felt rates were going to keep going up. And as you can tell from the graph, rates went down in more years than they went up. As the evidence demonstrates, a long term CD ladder will beat the returns of a short-term one. Go with the evidence, not your gut. Your overall returns are much, much more likely to be higher.
It is never too late to create a 5-year CD Ladder. Although every fiber in your brain will scream at you for doing a 5-year CD in this market, the rewards of such are clearly demonstrated.
I would love some discussion. Especially if you have been investing in CDs for a while. What do your historical returns say? Please share.
Finally, if you enjoy this information, please consider sharing with your Twitter, Facebook, LinkedIn, G+, etc., friends.
cd :O)
-- By Chris Duncan


